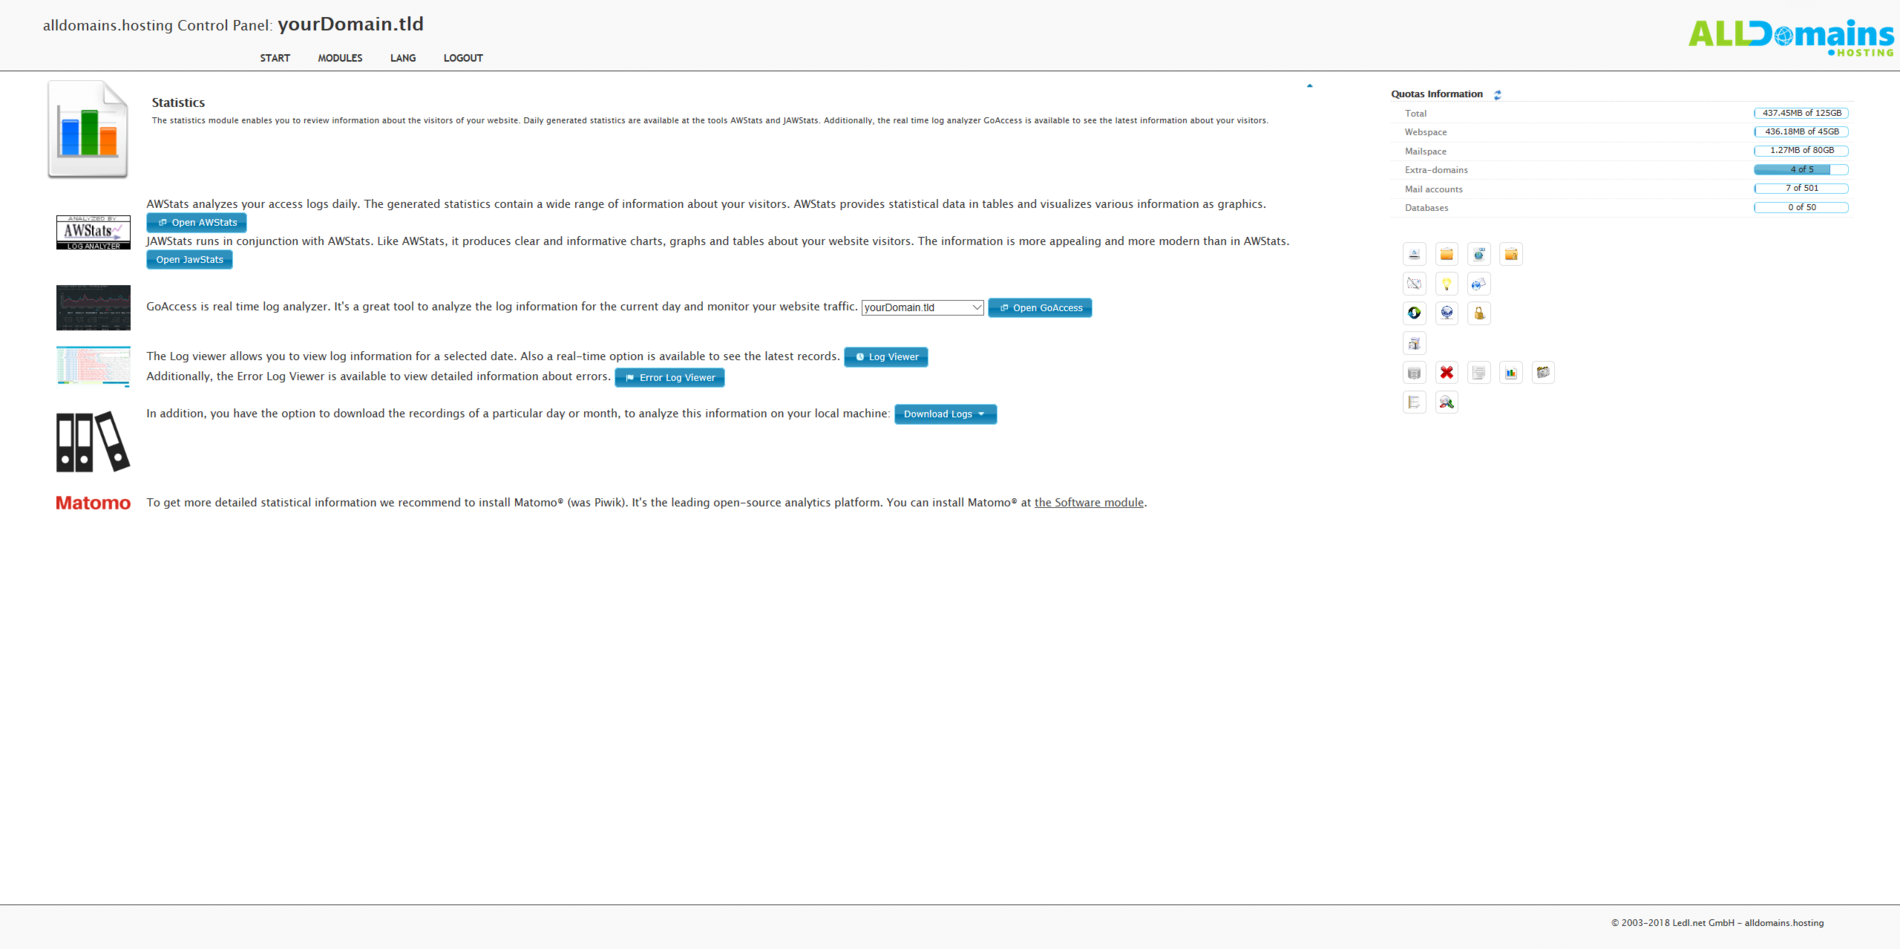
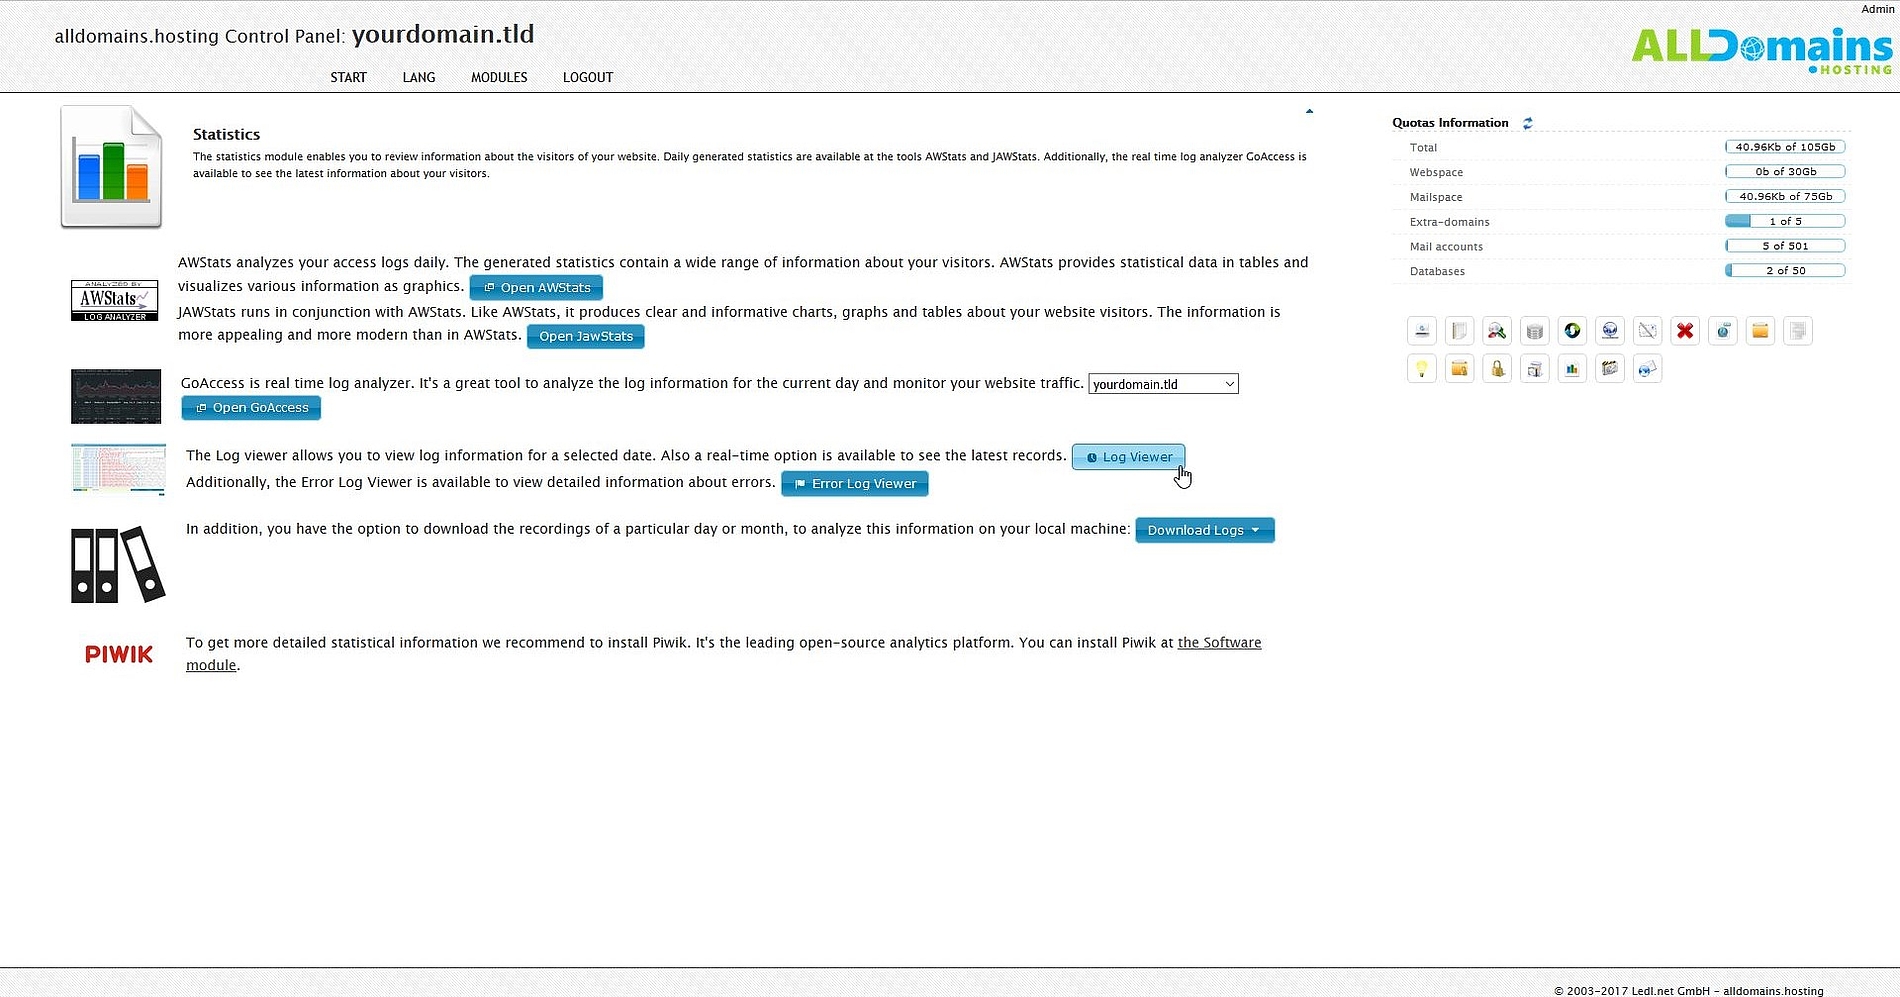
Statistics
With the Statistics module of your Hosting Control Panel you get detailed information about your website. For example the numbers of visitors, HTTP status codes, which countries your website visitors come from, which browser they used, number of page views, error logs and much more.
To analyse your website data like website-traffic, the number of accesses or the amount of time the visitors stayed on your website, we offer different programs for usage: "AWStats", JAWStats", the real-time analytics program "GoAccess" and the leading open-source analytics software "Matomo".
"AWStats" and "JAWStats" are quite identical in terms of the stored website data itself. The only big differences between these two programs are the layout and the design.
With "GoAccess" you have the opportunity to check all data referring to your website (HTTP status codes, visitors, etc.) in real-time.
The Control Panel module Statistics also includes a "Log Viewer" where you can get detailed information about the happenings of your website for the chosen date or you check the log files in real-time.
You also have the possibility to download the log files of your domain for a chosen day or even a whole month.
As an alternative to our Statistics module you can install the leading open-source analytics software "Matomo". If you want to install "Matomo" you have to open the Software module, then choose "Matomo" and follow the instructions of the installer.
Quick Access:
Start the Statistics module
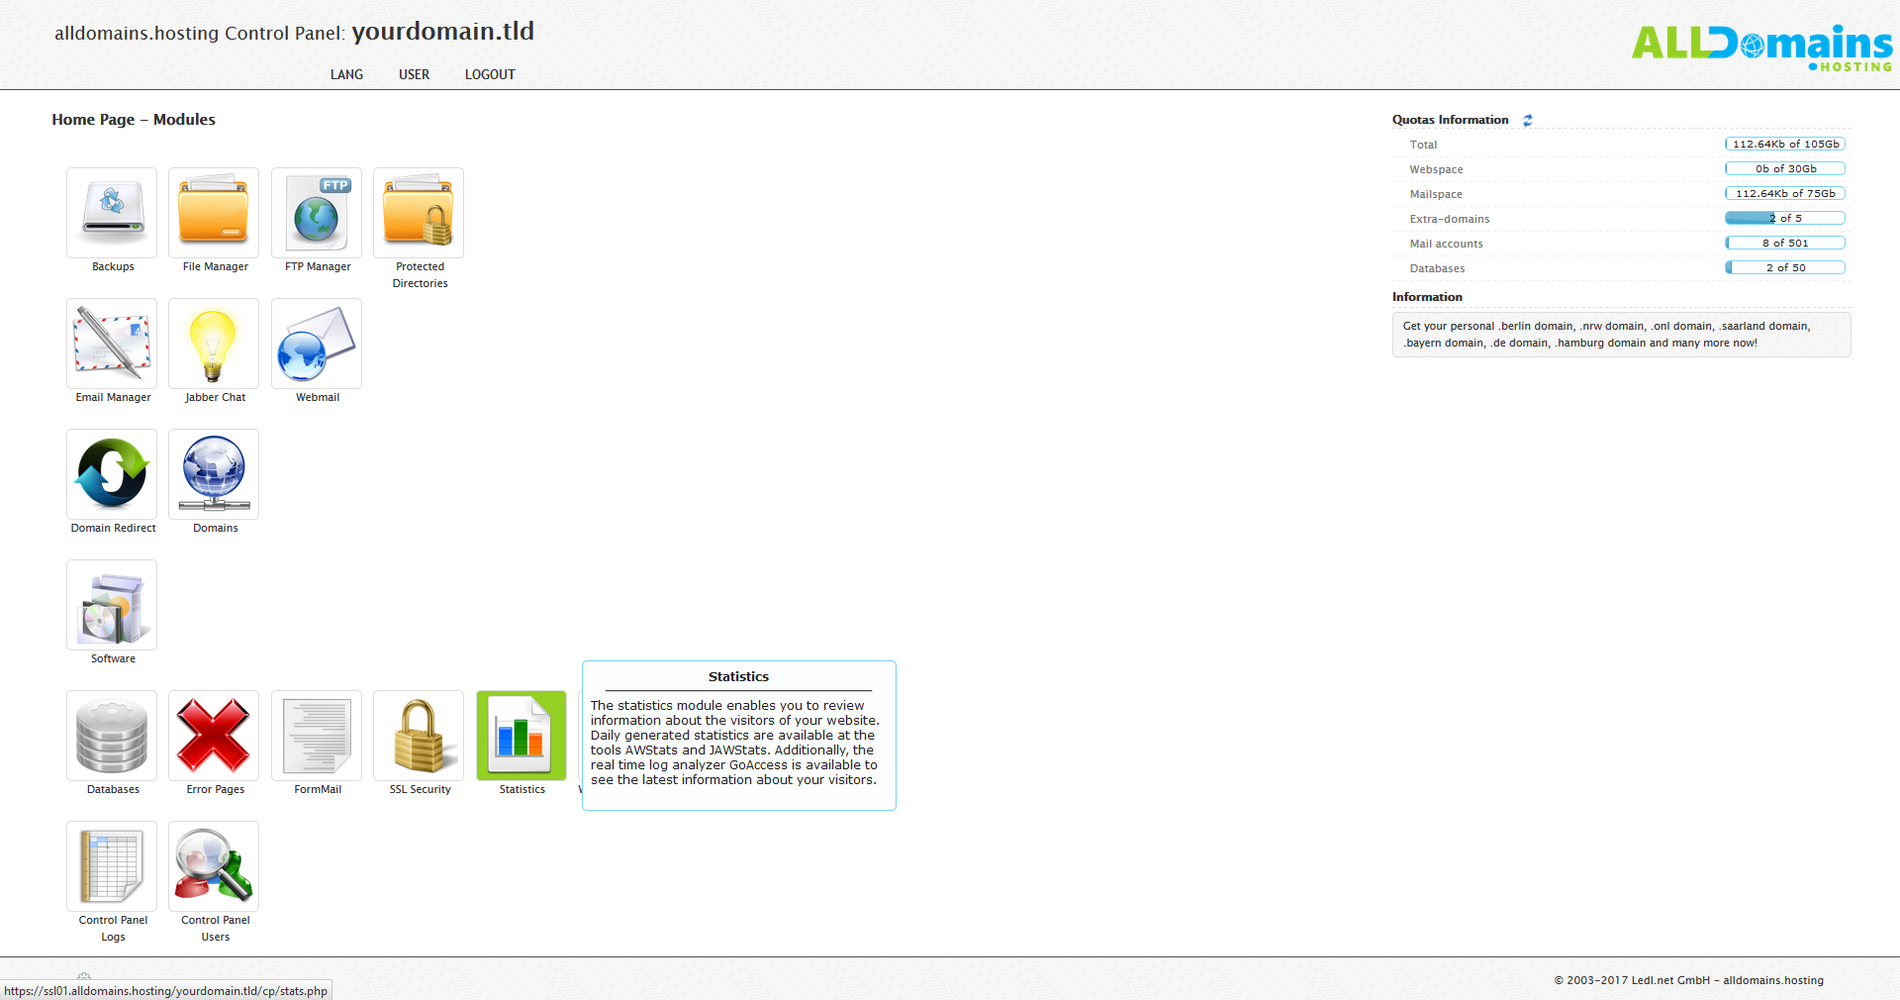
Before you can look at the extensive statistics of your website you have to login into the Control Panel.
You have 3 different possibilities to do so:
- either you enter "www.yourdomain.tld" (www.yourdomain.tld have to be replaced by your own domain) into the address bar of your browser
- or you use the Control Panel Login at our website
- or you start it directly inside your Customer Center
In your Customer Center switch to the tab "Purchases" and move your mouse over the hosting package and click on the link "Control Panel" at the side menu that popped up.

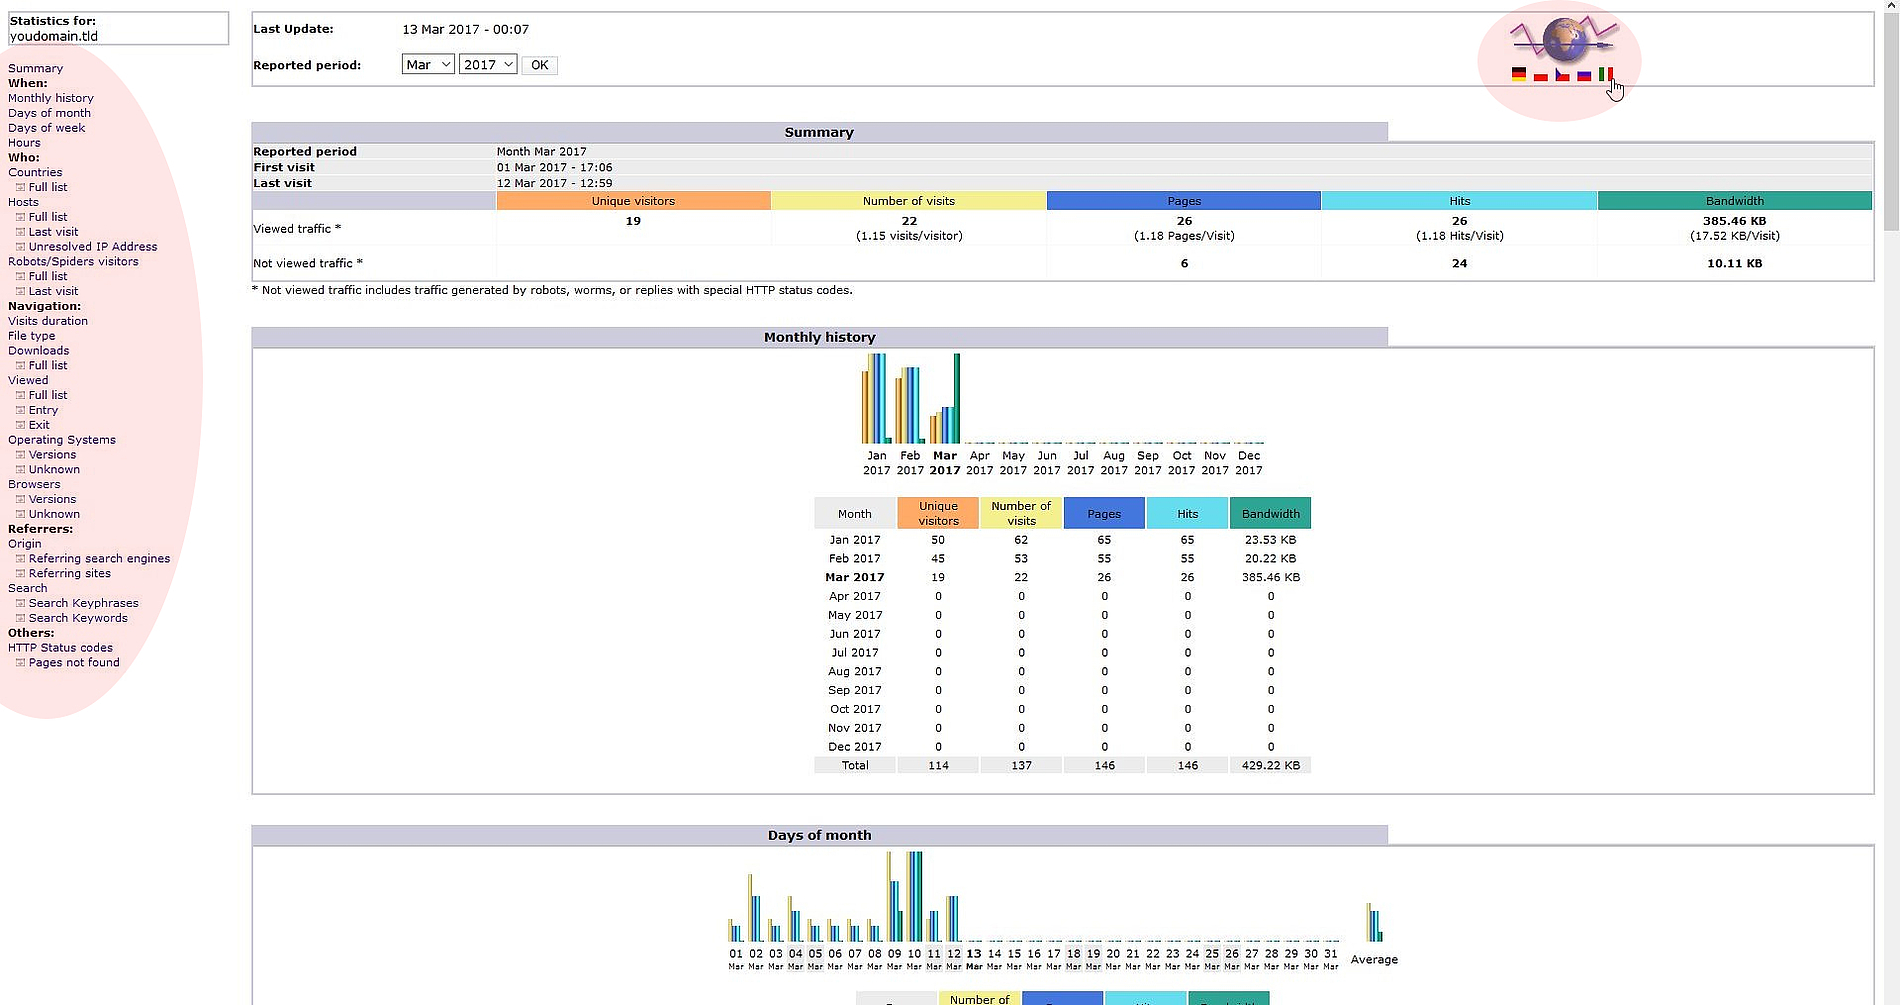
#AWStats
If you want to display your website statistics with "AWStats", simply click on the "Open AWStats" button in your Statistics module.
In the upper right corner you can switch the language of the page if you want to.
On the left hand side you have the menu where you can jump to the needed graphs or change the settings for the statistics, for example if the data is shown as a monthly history or just the data of every day of a week.

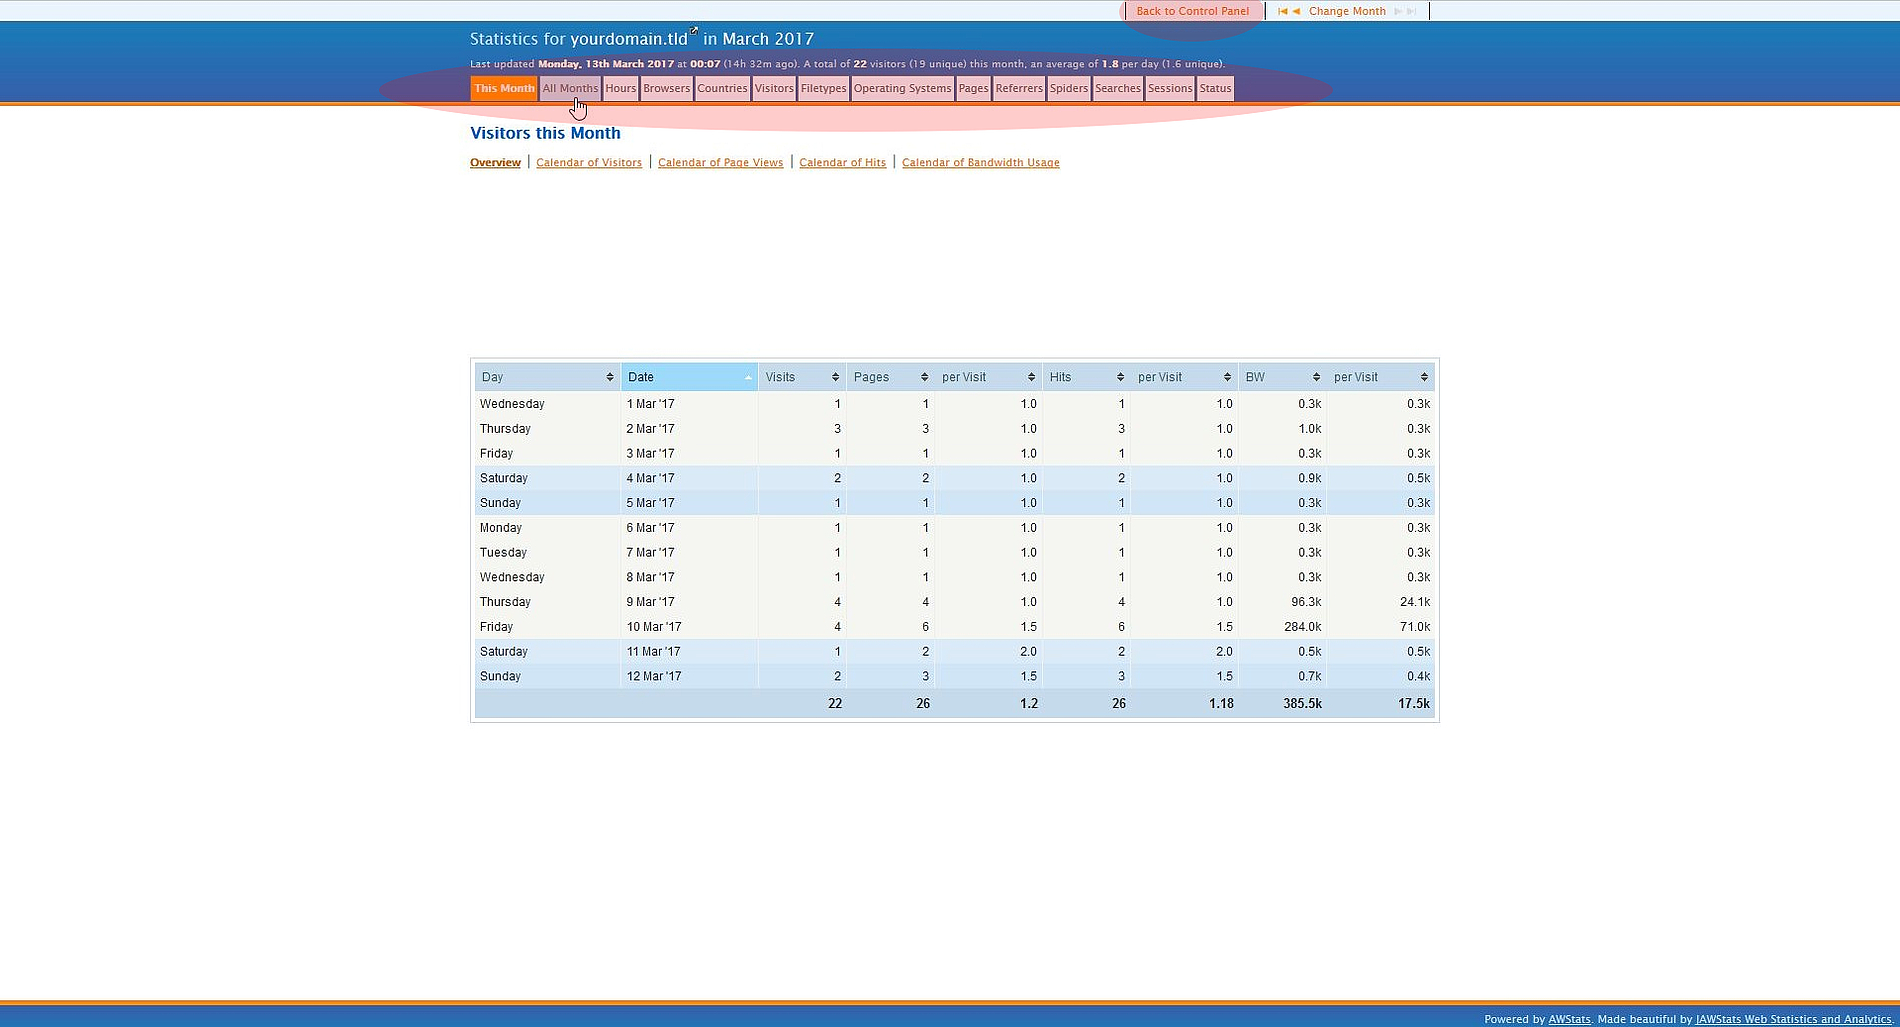
#JAWStats
If you click on "Open JAWStats" you will get all the statistics referring to your website shown by "JAWStats". As you can see is the design here a bit more pleasant than that one of "AWStats".
With the menu on the top you can switch between the different statistical categories:
With the "Back to the Control Panel" link at the top of the page you can go back to the "Statistics module".
|
|

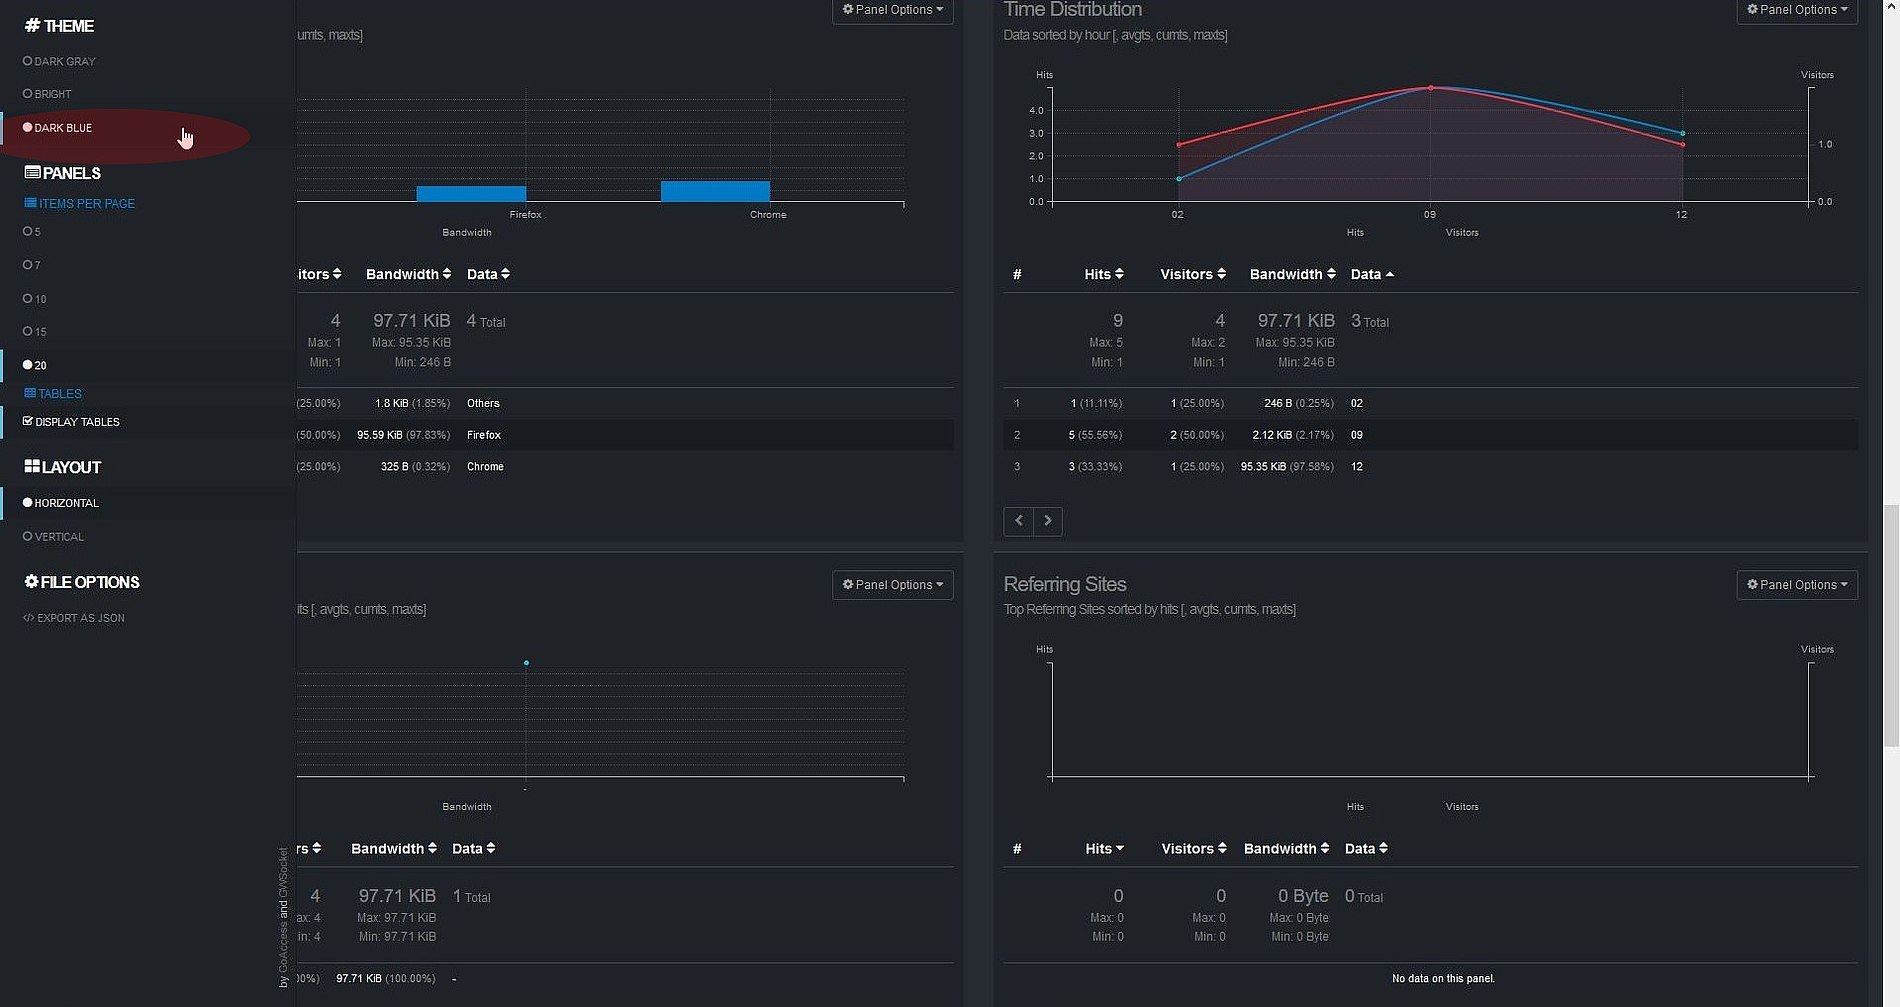
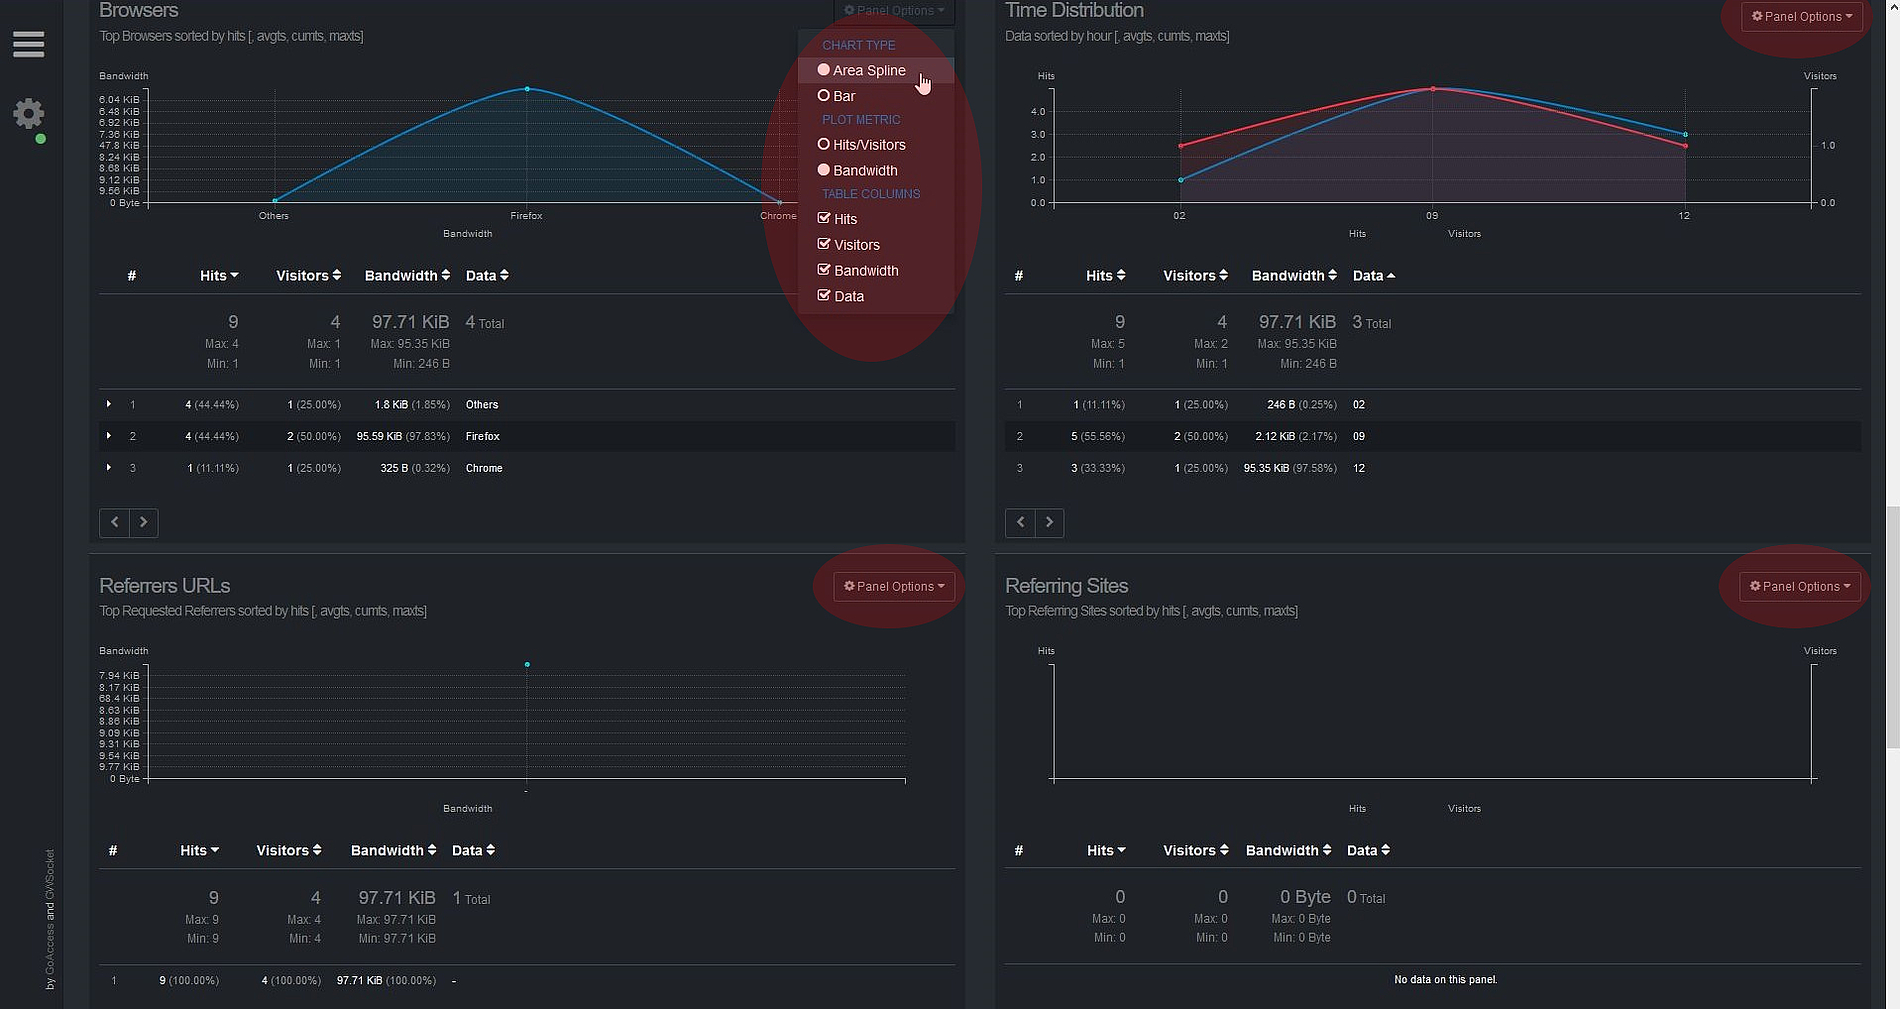
#GoAccess
"GoAccess" is a real-time analytics-program with which you are able to monitor your website data.
If you have several domains connected to your hosting package you can choose for which domain you want to see the real-time statistics.
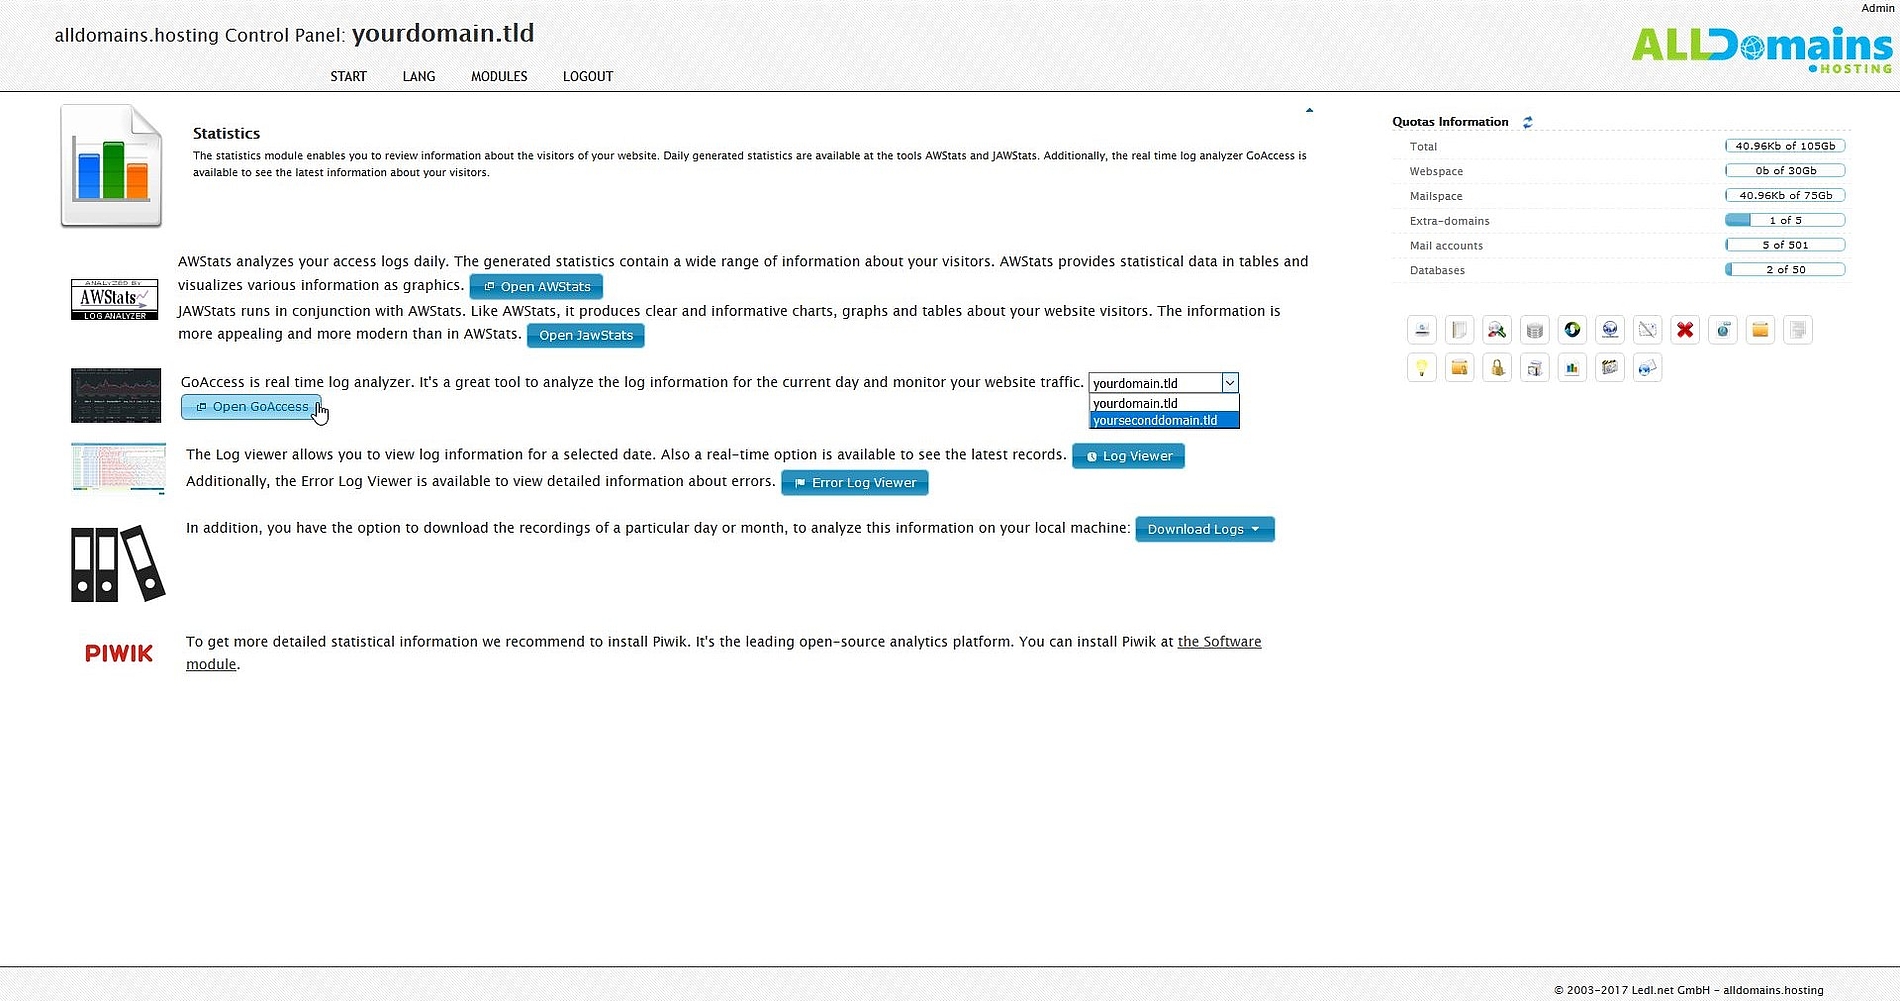
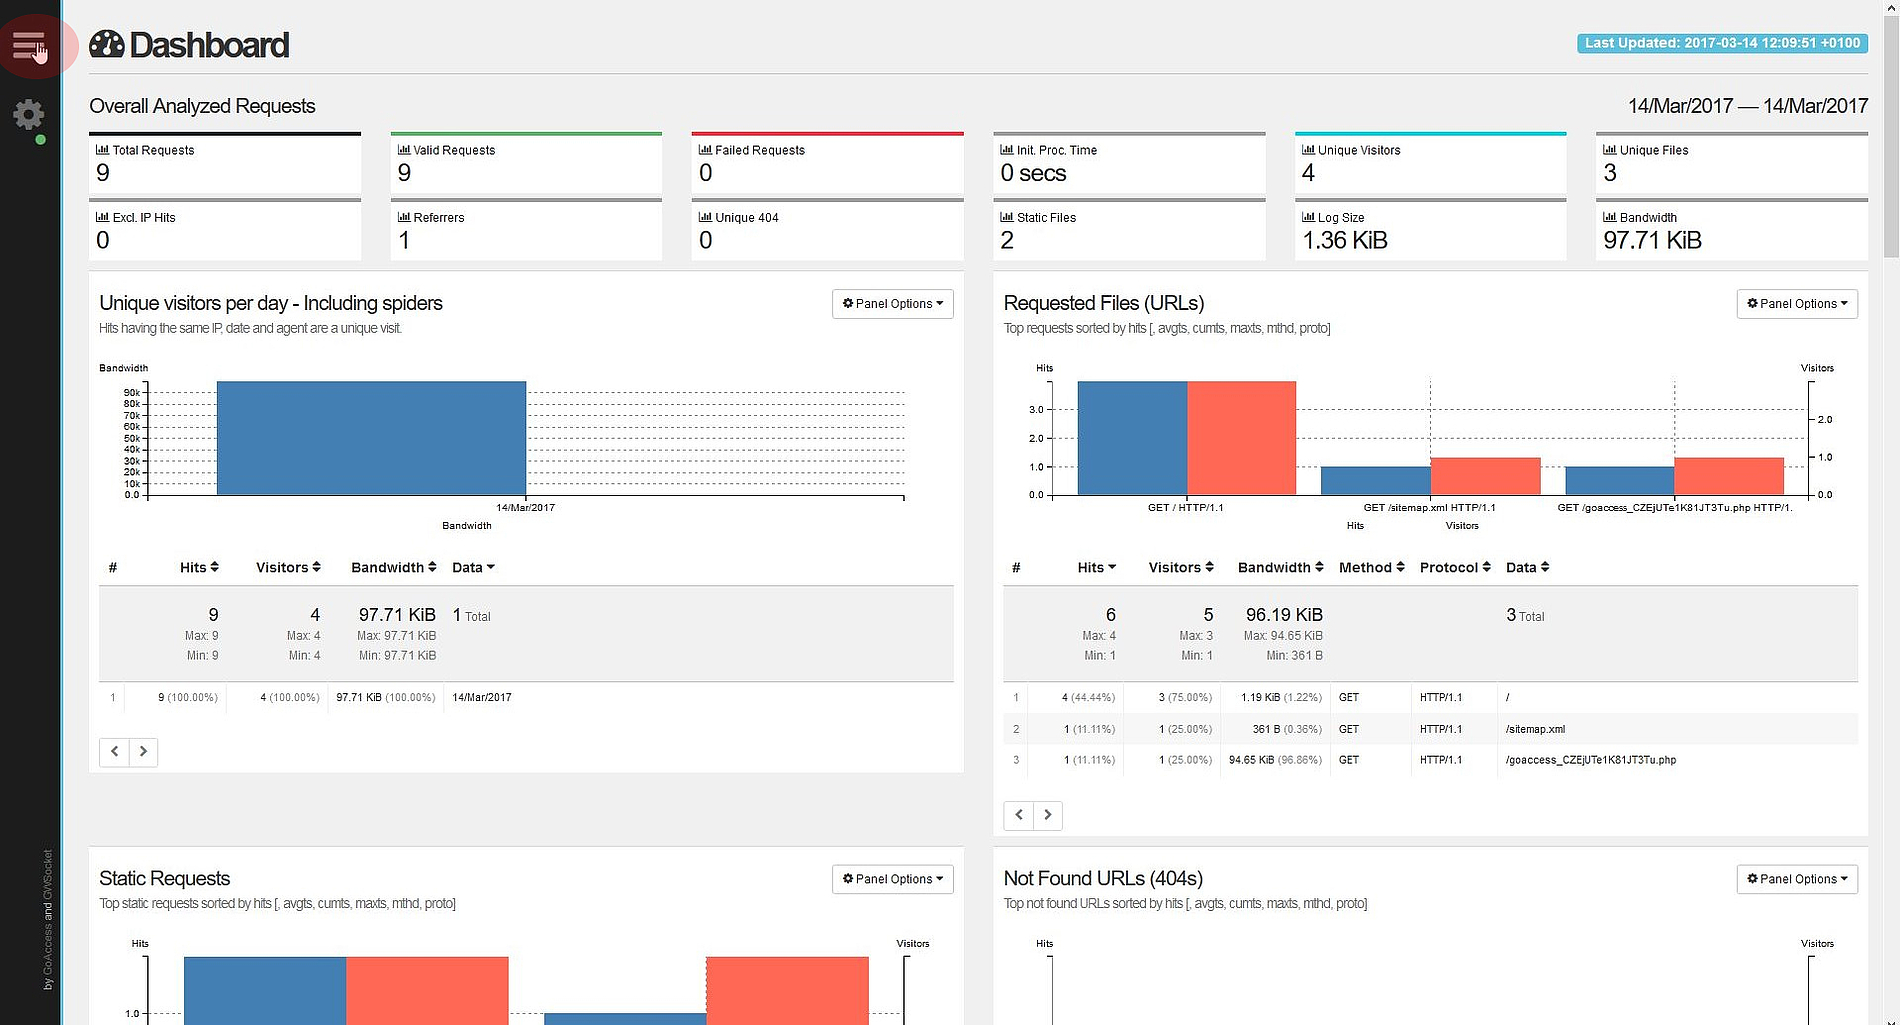
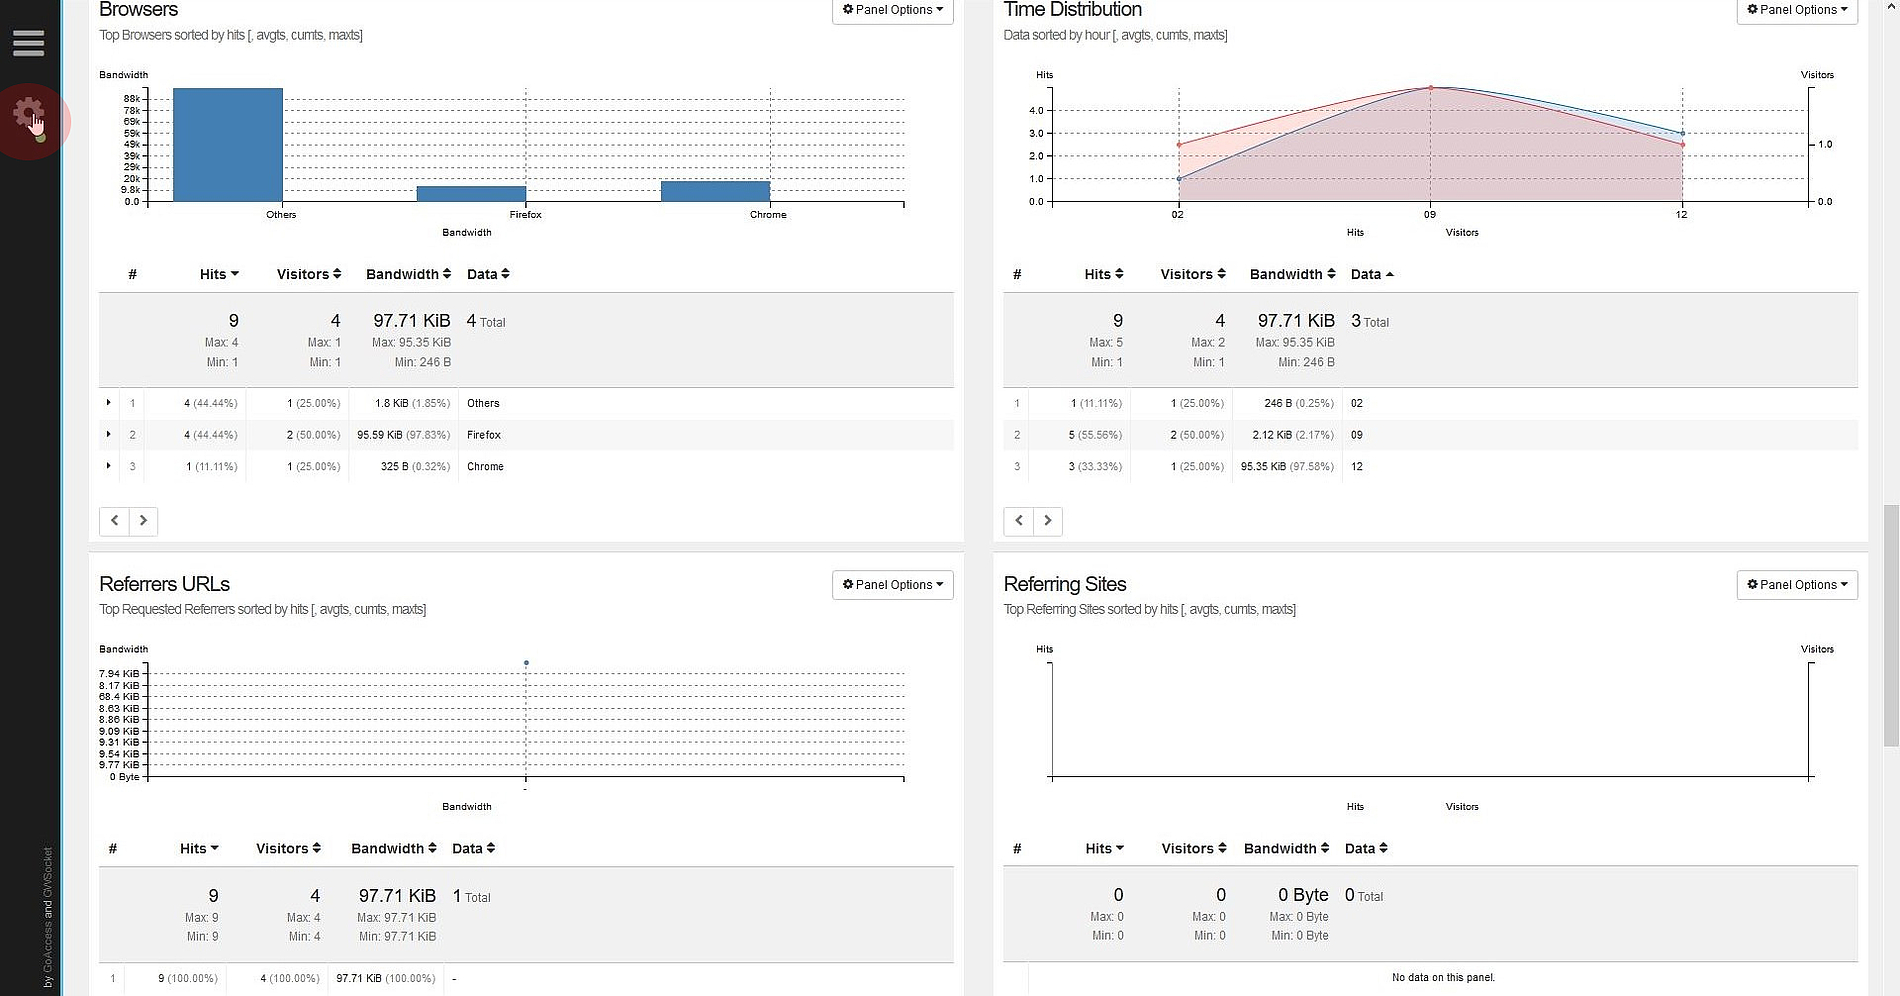
As soon as you have started "GoAccess" you can take a look at all your HTTP-statistics of the chosen domain in real-time.
In the upper left corner you see three crossbars with which you can take a look at the number of different statistics offered by "GoAccess".
Within this menu you can also jump to a needed graph immediately.
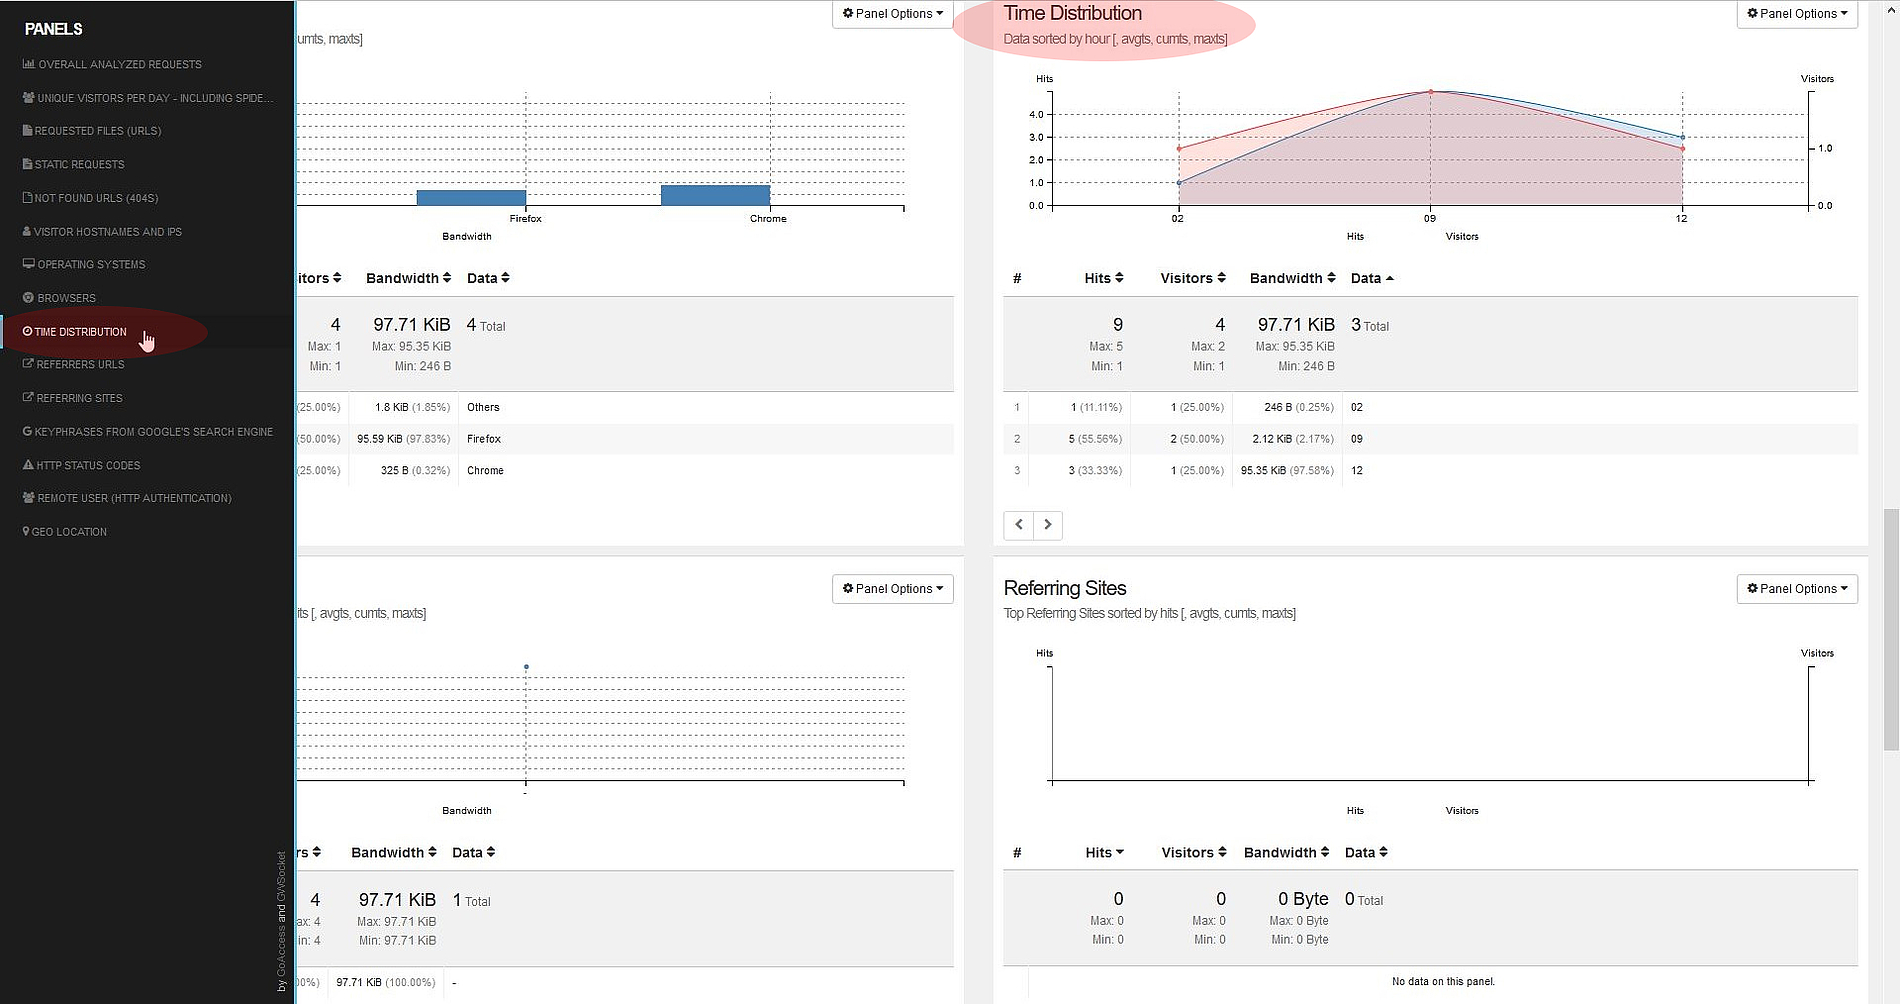
By clicking on the gear wheel beneath the three crossbars you open the settings referring to design and layout of the shown statistics.
In this menu you also have the possibility to download the stored "GoAccess" data within a JSON-file.
In the upper right corner of each graph you see the button "Panel Options". Here you can choose the layout and design settings of the specific statistic.
#Log Viewer
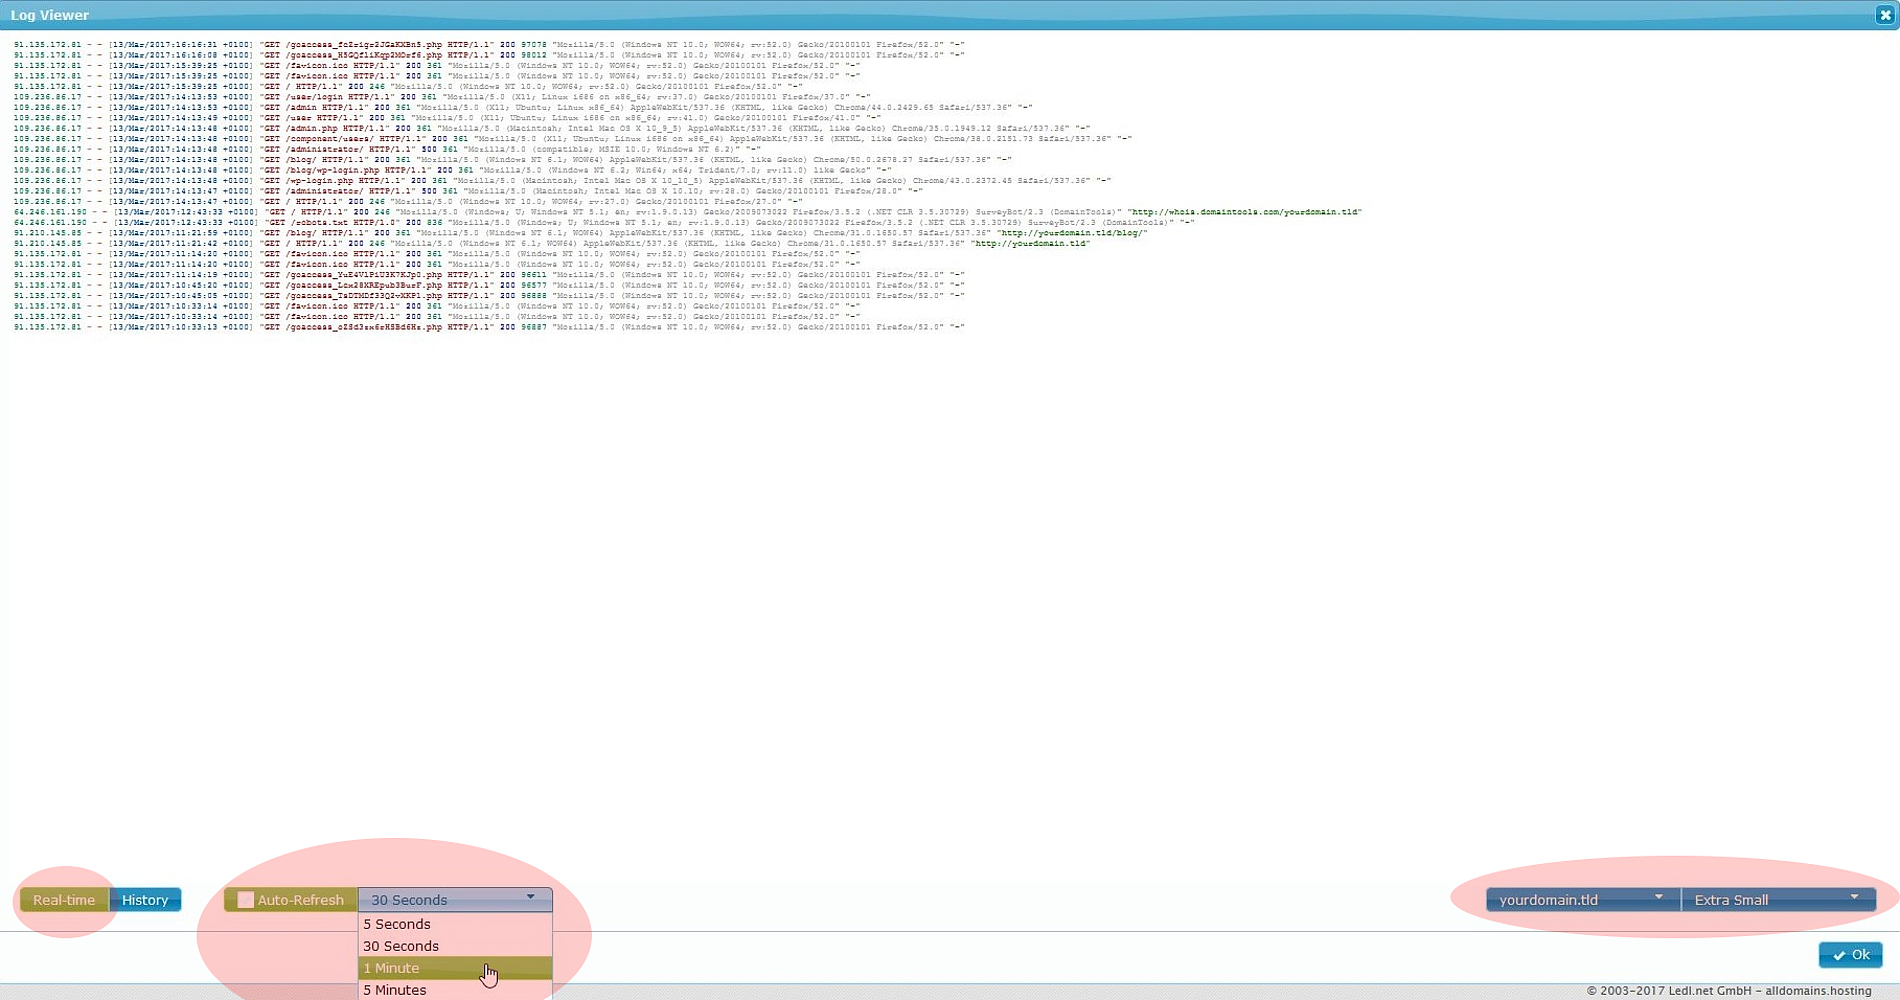
The “Log Viewer” shows you detailed log information about the selected date and the selected domain.
If you want to change the font size you can do so in the bottom right corner.
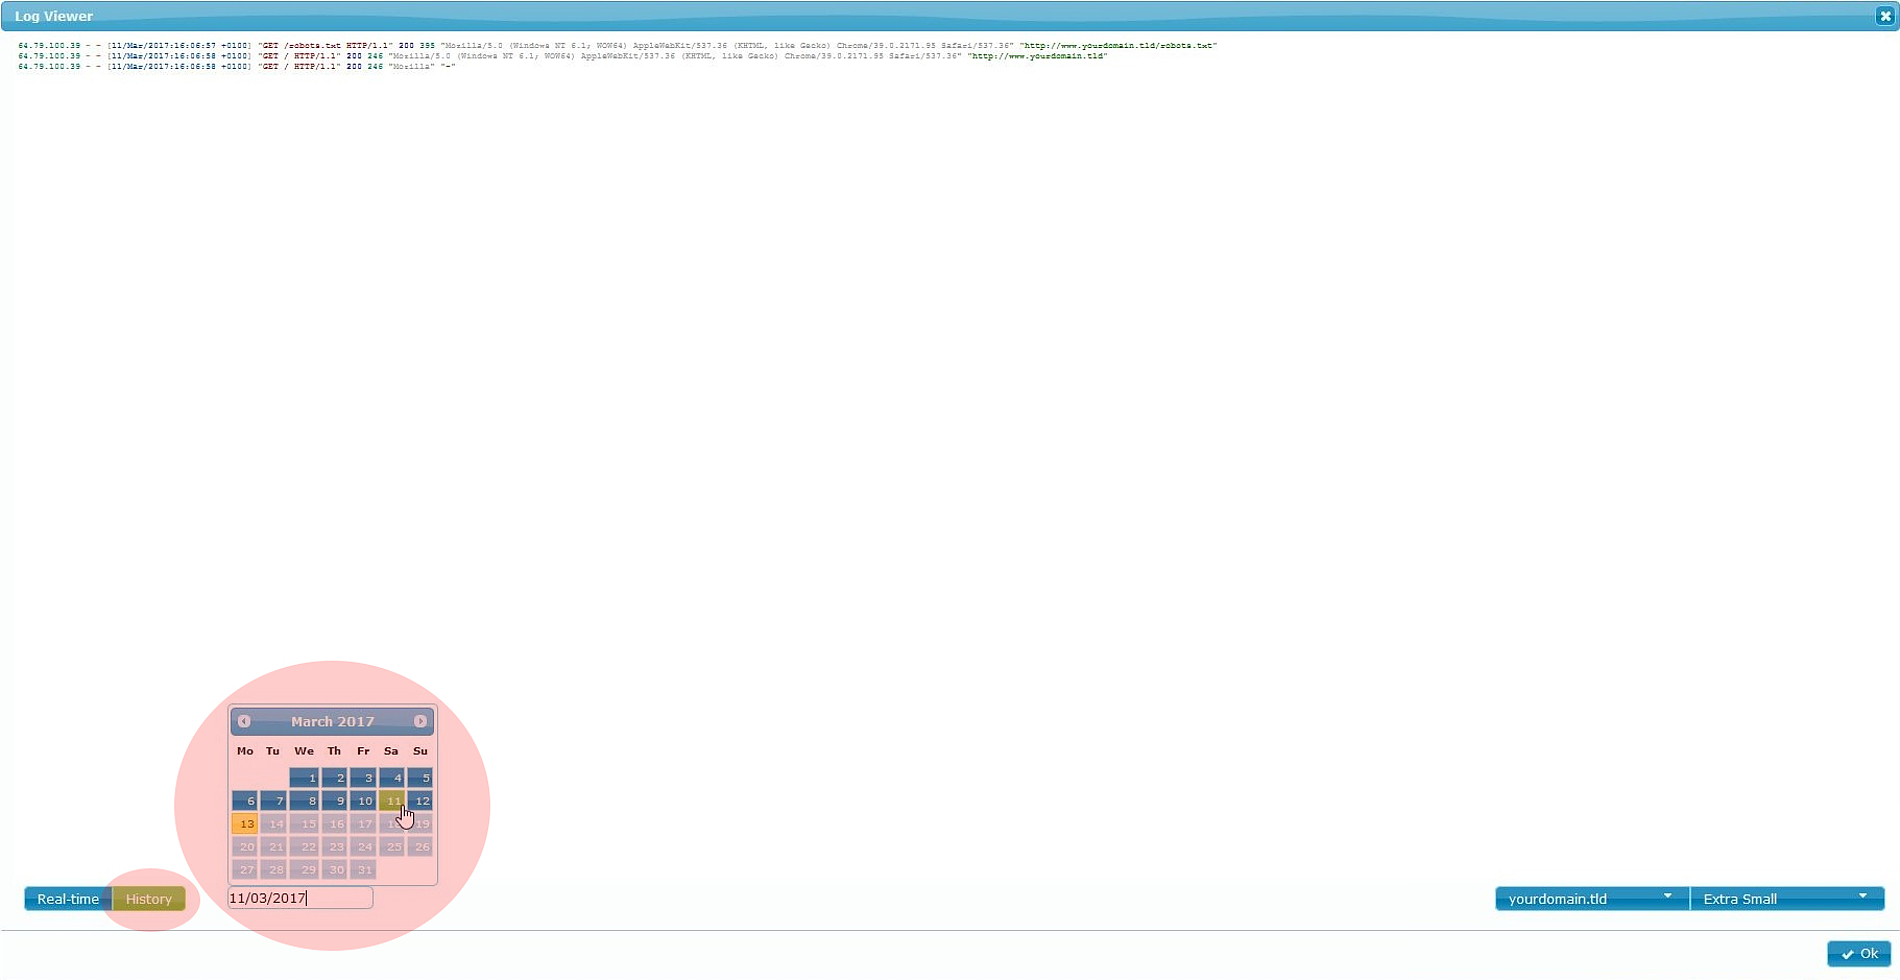

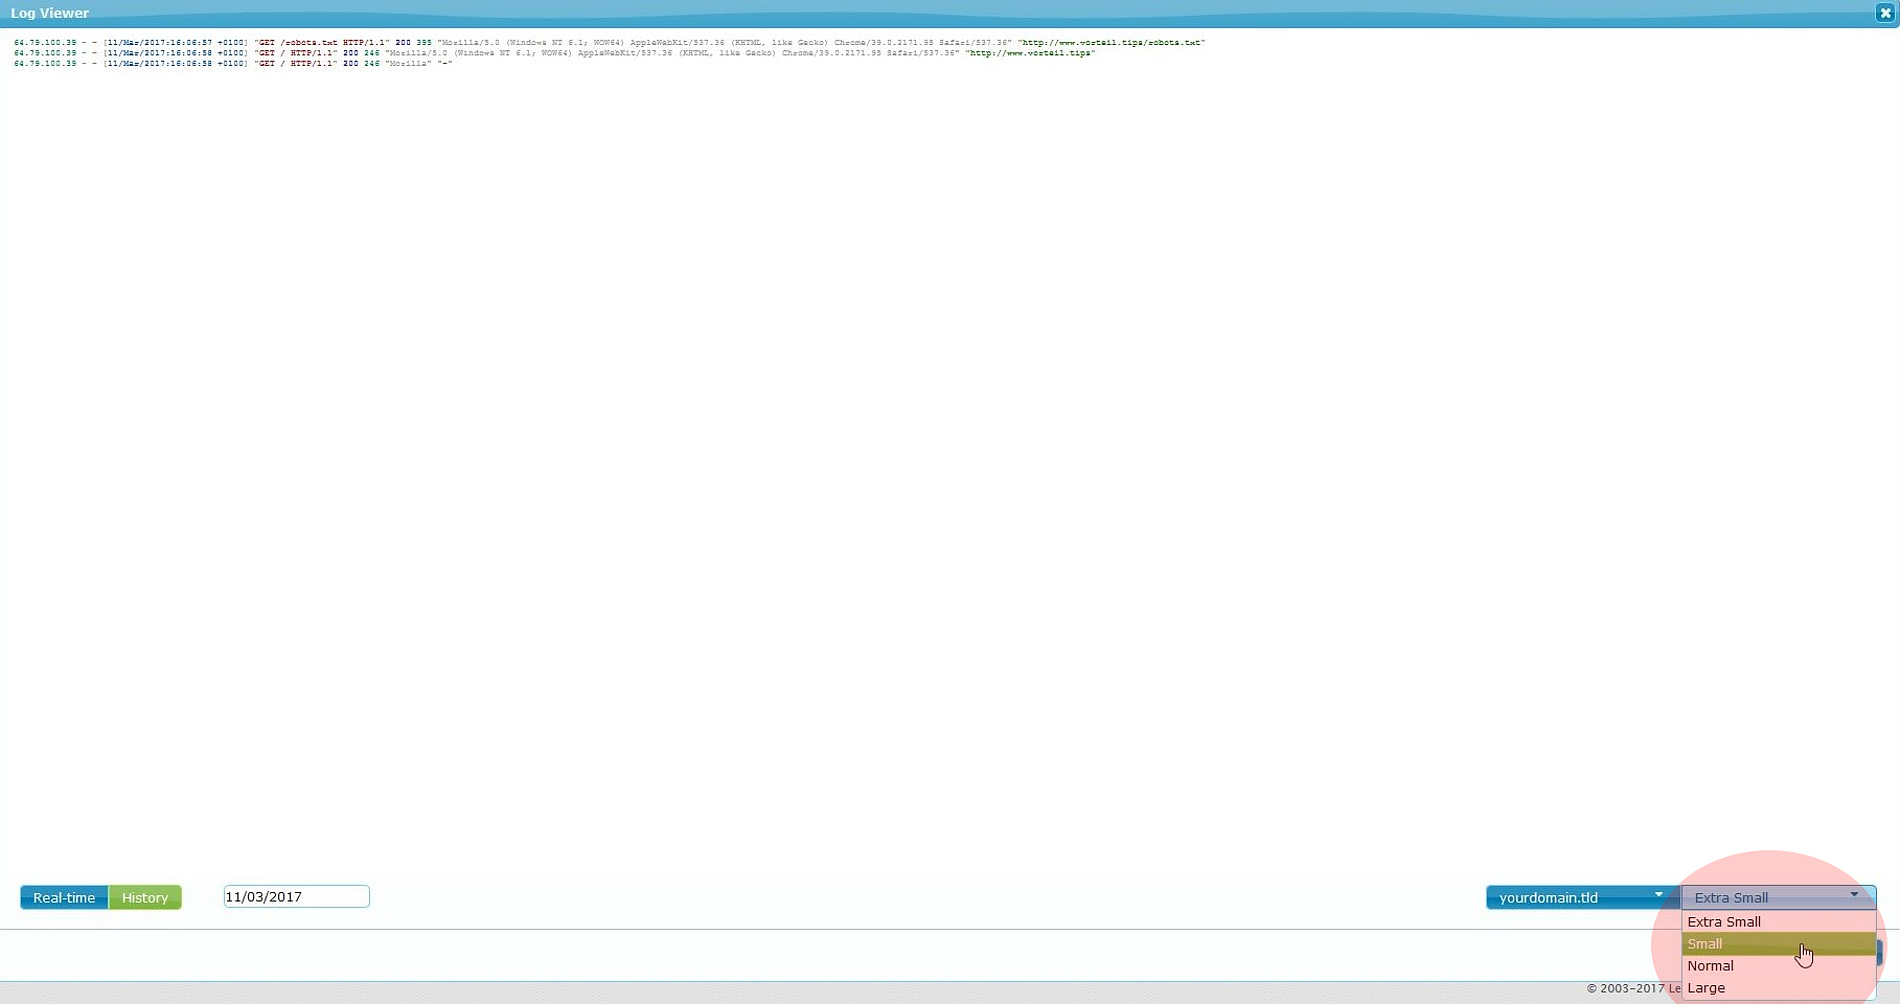
You also have the option to use the "Log Viewer" in real-time.
In the bottom left corner you can click on "Real-time" and afterwards you can choose the "Auto-Refresh" interval.
Like in the "History" mode of the "Log Viewer" you can also change the font size and the domain while using the "Real-time" mode.
#Error Log Viewer
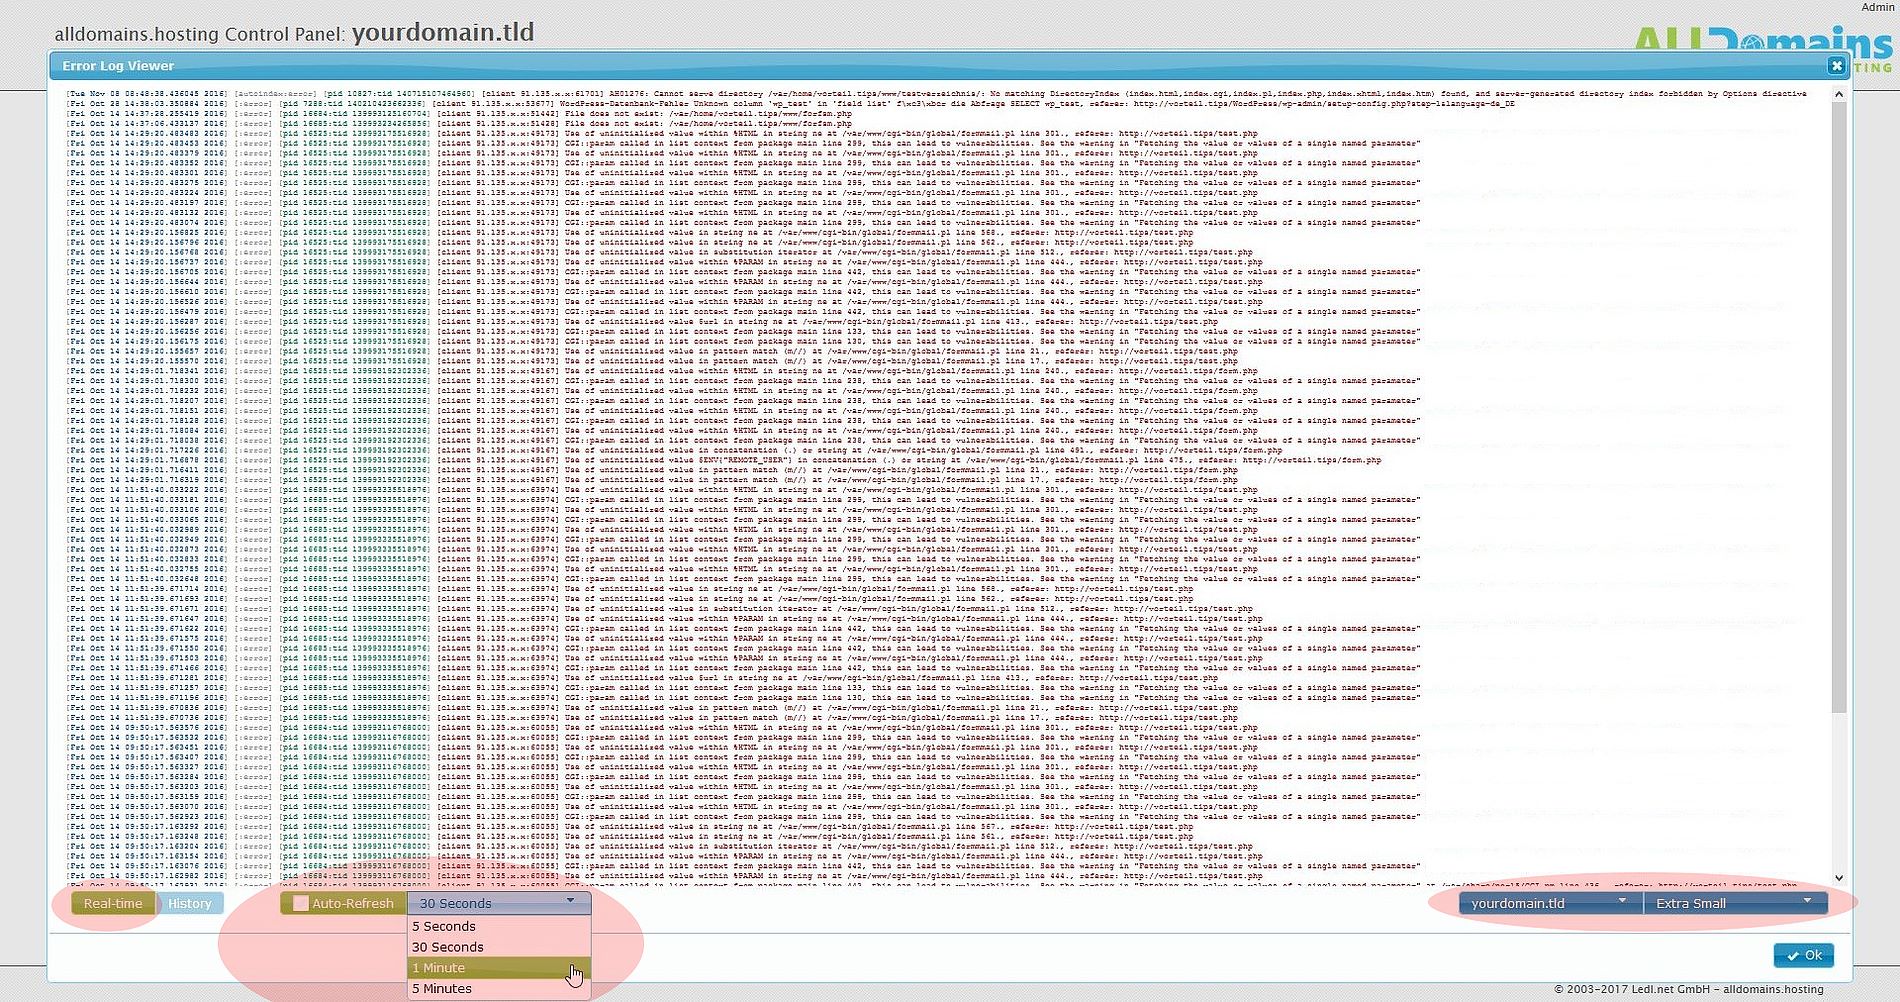
If you need some detailed information about errors of your website you can use the "Error Log Viewer".
The "Error Log Viewer" can only be run in real-time mode.
You can define an "Auto-Refresh" interval and for which domain you want to see the error logs. The font size of the logs can also be changed if this is needed.
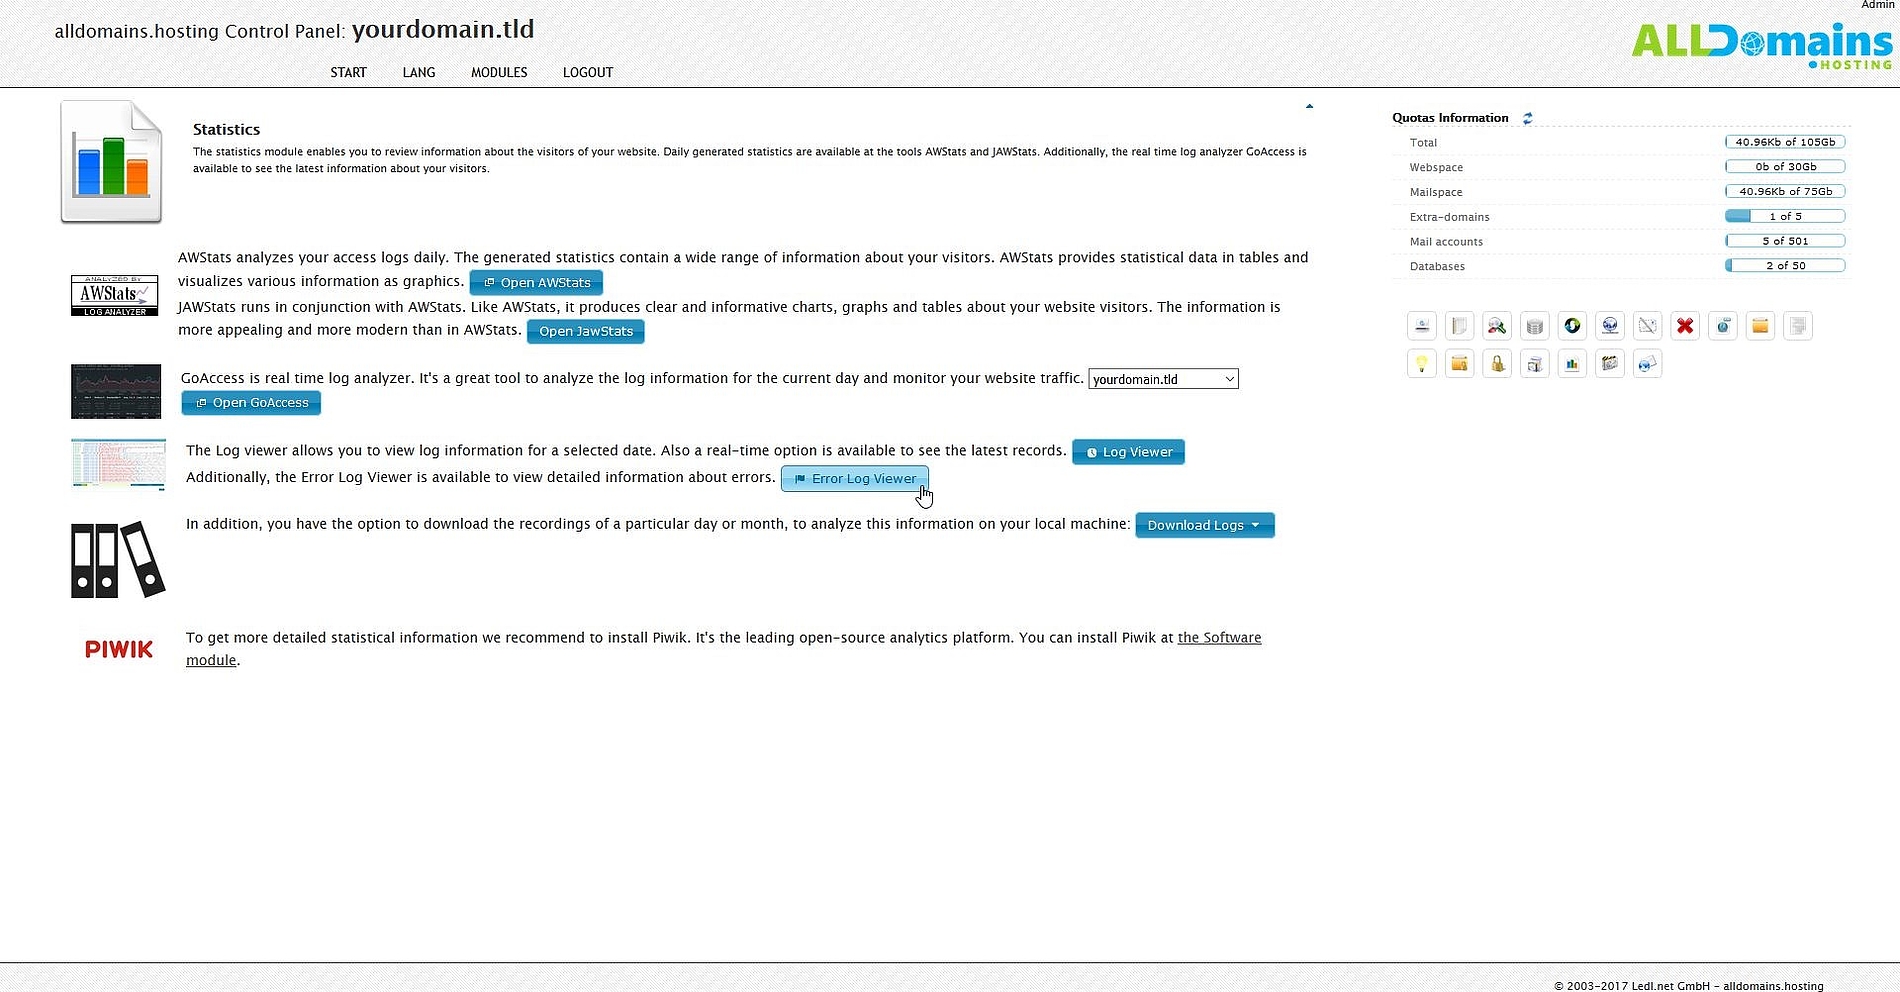
#Download Logs
You also have the possibility to download the records of a selected domain for a certain day or month.

#Matomo - analytics-software
For even more detailed information about your website you can install the leading open-source analytics-software "Matomo".
Simply start the Software module of your Hosting Control Panel, click on "Install", choose "Matomo" and follow the instructions of the installer.